Quick summary: Discover how farm mapping solutions are transforming Uganda’s smallholder agriculture. Digitize plots, enhance traceability, ensure compliance, and unlock market access for cocoa, cashew, ginger, hibiscus, and sesame farmers.
Farm Mapping in Uganda enables the digitization of smallholder plots using GPS, mobile data collection, and geospatial platforms to create precise farm boundaries and location records. This process supports traceability, land-use verification, and compliance with sustainability and deforestation-free requirements across coffee, cocoa, spices, and other agricultural supply chains. By converting fragmented smallholder farms into mapped, verifiable datasets, Farm Mapping in Uganda improves supply-chain transparency, strengthens farmer inclusion, and enables exporters and buyers to meet regulatory, ESG, and market-access requirements with reliable, plot-level data.
Smallholder farmers are the foundation of Uganda’s agricultural sector, accounting for over 80% of farm households and contributing the majority of national food production and agricultural exports. Most smallholders cultivate small, fragmented plots averaging 0.5–2 hectares, often without formally documented boundaries or digital land records. This limited farm-level visibility creates challenges for buyers, cooperatives, processors, and financial institutions that require reliable data for traceability, credit assessment, and compliance with international standards.
Land tenure in Uganda is complex, shaped by customary, Mailo, freehold, and leasehold systems, which frequently overlap and generate boundary disputes. The absence of verified geolocation data and mapped plots restricts farmers’ ability to participate in modern, traceability-driven value chains and discourages long-term investment.
Uganda’s diverse agro-ecological zones support key crops such as coffee (Robusta and Arabica), maize, beans, cassava, bananas (matooke), rice, sesame, cocoa (emerging), tea, sugarcane, and horticulture. Coffee dominates export agriculture, particularly in Central, Eastern, and Western regions.
These structural constraints fragmented landholdings, undocumented plots, and weak land-data systems highlight why digital farm mapping is increasingly critical to improving productivity, unlocking finance, and enabling sustainable market access for Uganda’s smallholder farmers.
Ensure regulatory readiness and traceable sourcing with smart farm mapping. Learn how mapping every plot can streamline compliance and reduce risk across your supply chain.
[Explore the Blog →]
Digitally profile farmers to capture verified data, improve traceability, and strengthen ESG and sustainability reporting. Discover how digital onboarding empowers both farmers and buyers.
[Read the Blog →]
Digitizing farms with GPS coordinates, mapped boundaries, and verified farmer identities allows Ugandan authorities and agribusinesses to deliver inputs accurately. Without mapped plots, input programs often suffer from duplication, leakage, and poor targeting. Plot-level mapping enables:
Most Ugandan smallholders lack formal land titles or verified farm records, limiting access to credit. Digitized plot maps allow:
Uganda faces increasing climate risks from erratic rainfall to prolonged droughts and floods. Digitized plots enable:
Uganda’s key export commodities coffee, cocoa, sesame, tea, and maize increasingly face stringent ESG and EUDR-driven traceability requirements for markets like the EU, where digitized farm maps deliver verifiable geolocation data to cut shipment rejection risks and secure access. Coffee leads with $2.2 billion in FY 2024/25 from 462,000 tons (7.7 million bags), doubling year-over-year and hitting $2.09 billion for June 2024-May 2025 (7.43 million bags, +43% volume in May), comprising 12.6% of total exports primarily to Europe (Italy/Germany at 67–69%). Cocoa, sesame, and tea fuelled a 6.9% overall export rise, with sesame boosting January 2025’s +50.4% earnings surge and tea at $88.36 million (80,000 tons) in 2022, while maize supports regional trade amid diversification efforts. These sectors underscore the value of digital traceability in protecting $9.1 billion+ in annual export potential against compliance barriers.

Farm mapping in Uganda combines GIS tools, mobile data collection, satellite imagery, and in high-value zones drone surveys to digitize smallholder plots with accurate, verifiable geolocation. Each mapped farm receives a unique digital identity that supports traceability, financing, climate monitoring, and compliance with export and sustainability standards.
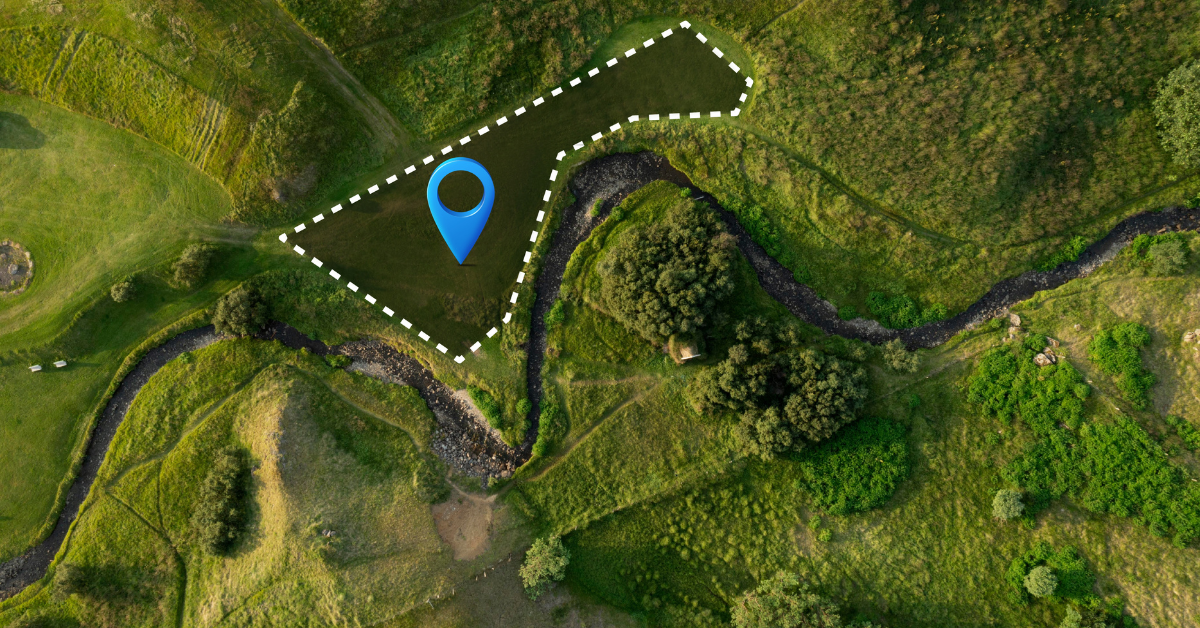
Enumerators or extension officers walk farm boundaries using GPS-enabled mobile apps to capture latitude–longitude points. These are converted into polygon maps that define exact plot size, shape, and location reducing boundary disputes and establishing reliable farm records.
Digital platforms capture farmer profiles, crop types (coffee, maize, rice, bananas, cocoa), input use, and photos. Offline functionality is critical in rural Uganda, with data syncing once connectivity is available.
Satellite imagery and NDVI analysis track crop health, canopy cover, and stress across districts. Machine-learning models support crop classification, yield estimation, and early detection of drought or pest pressure.
In coffee, tea, cocoa, and horticulture clusters, drones provide high-resolution insights on tree counts, canopy density, and plant health supporting precision agriculture, export compliance, and sustainable sourcing programs.
Northern Uganda holds large expanses of arable land with increasing commercial agriculture. Key farming districts include Gulu, Lira, Apac, Kitgum, and Amuru.
Key crops:
● Maize and sorghum (staple cereals)
● Rice (lowland and irrigated schemes)
● Sesame (simsim) – a leading export crop
● Sunflower and legumes
Average plot sizes range from 1–3 hectares, making GPS-based boundary mapping essential for production planning and financing.
Eastern Uganda is one of the country’s most agriculturally productive regions, characterized by dense smallholder farming.
Key crops:
● Coffee (Robusta)
● Sugarcane
● Rice
● Maize
High farm density and fragmented plots make digital mapping critical for traceability and aggregation.
The Central Region supports both food and cash crops and supplies urban markets.
Key crops:
● Robusta coffee
● Bananas (matooke)
● Horticulture and poultry-feed crops
Smaller plot sizes (0.5–1.5 hectares) increase the need for precise polygon mapping.
This region anchors Uganda’s export agriculture.
Key crops:
● Arabica coffee
● Tea
● Irish potato and dairy fodder
Hilly terrain and intercropping systems make high-resolution mapping and satellite validation especially important for compliance and sustainability programs.
Farm mapping is becoming foundational across Uganda’s agricultural ecosystem, providing reliable, geotagged farm data for decision-making, traceability, and compliance.
● Government & Ministry of Agriculture (MAAIF):
Uses mapped plots to improve input distribution, register farmers, plan food security programs, and strengthen land-use and productivity monitoring.
● NGOs & Development Partners (IFAD, USAID, GIZ, World Bank):
Rely on geospatial farm data to track project impact, support climate-smart agriculture, and ensure transparency in donor-funded programs.
● Exporters, Processors & Off-Takers (coffee, tea, cocoa, grain):
Require mapped farms for traceability, supply assurance, and compliance with export and sustainability regulations (including EUDR).
● Agri-Finance & Input Providers:
Use mapped plots for credit verification, risk assessment, insurance design, and efficient last-mile input delivery.
● Extension & Advisory Services:
Depend on accurate farm boundaries and crop data to deliver targeted advice, monitor GAP adoption, and improve farmer productivity.
Digitizing smallholder farms in Uganda is critical for productivity, financing, and export compliance, but several constraints slow large-scale adoption.
1. Limited Rural Connectivity
Many farming areas have weak mobile coverage and unreliable internet, affecting real-time data syncing and farmer onboarding. Offline-capable mapping tools are essential.
2. Informal Land Tenure Systems
Most smallholders farm under customary or communal land arrangements without formal titles. Unclear boundaries and overlapping claims require community-based validation during mapping.
3. Cost Constraints
GPS devices, satellite data, field teams, and training create cost barriers for smallholders and local institutions. Scalable, donor- and government-supported models are needed.
4. Low Digital Literacy & Language Diversity
Uganda’s farmers speak multiple local languages, and digital literacy varies widely. Mapping platforms must support local-language interfaces and simple onboarding.
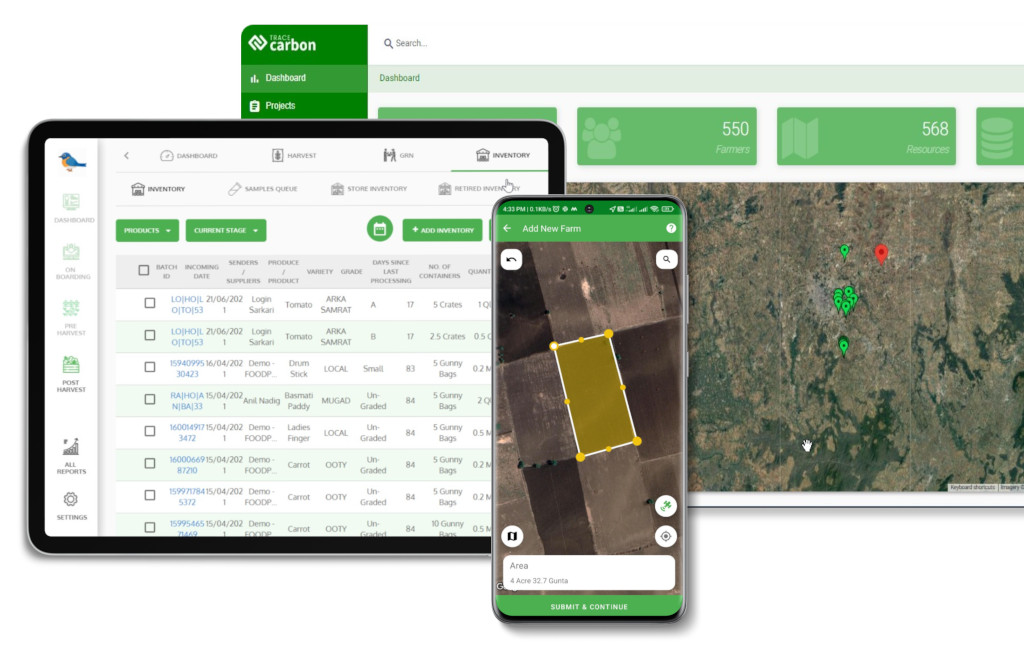
TraceX Farm Management Platform provides a full-stack digital infrastructure that enables accurate, scalable, and compliant farm mapping across Uganda’s diverse agricultural regions. The platform is designed to support governments, NGOs, processors, and financial institutions with real-time visibility into farmer networks and crop production systems.
TraceX platform enables extension agents to capture precise farm boundaries using GPS-enabled mobile apps, creating unique digital identities for each plot.
Mapped plots are linked to verified farmer profiles including crops, acreage, production history, and basic KYC data supporting sourcing, lending, and program delivery.
Integrated NDVI and remote sensing tools monitor crop health, stress, and yield potential, enabling climate-smart advisory and early warnings.
All geolocation and farm records are securely stored on blockchain, ensuring tamper-proof data for EUDR, certification, and ESG compliance.
From farm to aggregator, processor, and exporter, TraceX connects transactions and movements delivering full transparency for Uganda’s export-driven value chains.
Farm mapping in Uganda is rapidly becoming foundational to modern, competitive agriculture. By digitizing smallholder plots with verified geolocation, polygon boundaries, and farmer profiles, stakeholders gain the visibility needed for traceability, climate-risk management, financial inclusion, and export compliance. As demand grows for origin-verified, sustainable commodities, farm mapping transforms informal production systems into trusted, data-driven supply chains positioning Ugandan farmers, exporters, and institutions for long-term resilience and global market access.
Unlock the full potential of your farm! Explore our comprehensive guide to farm management and discover strategies to boost productivity, streamline operations, and enhance traceability.
Digitize your farm for a sustainable future! Learn how farm management software can help smallholders and agribusinesses monitor crops, ensure compliance, and meet global sustainability standards.
See your farm like never before! Discover how GIS technology is transforming agriculture with precise farm mapping, crop monitoring, and data-driven decision-making for higher efficiency and traceability.
Farm mapping involves digitally capturing the location, boundaries, and details of smallholder plots using GPS or GIS tools to improve traceability and compliance.
It helps verify land access, monitor crop production, ensure compliance with export regulations, and strengthen access to premium global markets.
Key export crops such as cocoa, cashew, ginger, hibiscus, and sesame benefit significantly from plot-level digitization for traceability and quality monitoring.
Digitized farm data allows verification of environmentally responsible practices, deforestation-free sourcing, and ethical smallholder engagement.
Yes. By providing verifiable origin data, farm mapping increases buyer confidence, reduces compliance risks, and helps exporters meet international standards.