Quick summary: Discover the top 10 high-carbon emission products in agribusiness, including beef, dairy, rice, palm oil, and soy. Learn key drivers of emissions, their environmental impact, and strategies for sustainable sourcing and carbon reduction.

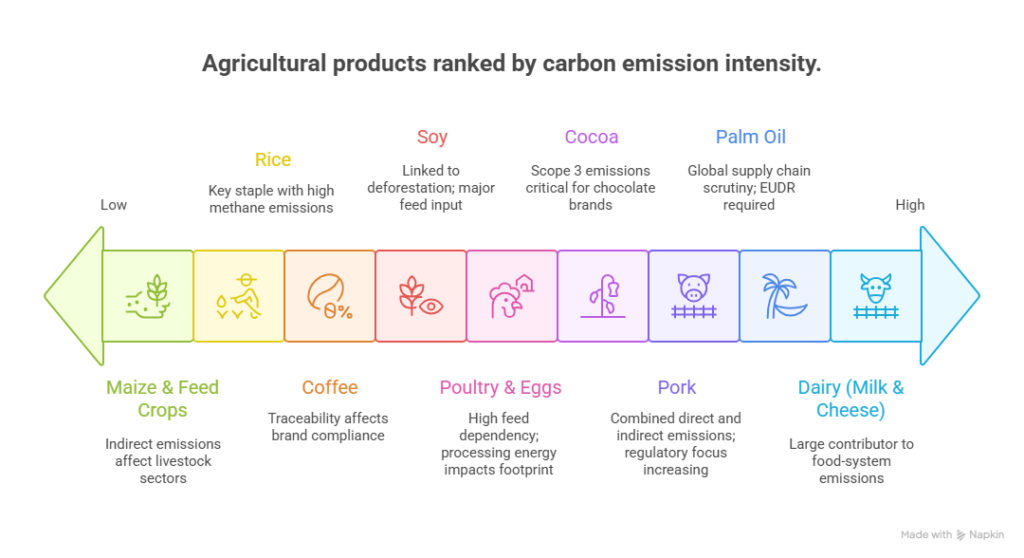
The top High-Carbon Emission Products in agribusiness are those that generate substantial greenhouse gases across production, land-use change, inputs, and supply chain logistics. Leading contributors include beef, lamb, dairy, palm oil, cocoa, coffee, rice, soy, rubber, and maize. These commodities drive emissions through methane release, fertilizer use, deforestation, energy-intensive processing, and long-distance transport. Identifying and addressing these high-emission products is critical for reducing agriculture’s climate footprint and meeting global sustainability and net-zero commitments.
Agribusiness products vary widely in their carbon intensity, largely due to differences in production systems, land-use impacts, and biological emissions. Products linked to deforestation, land conversion, or intensive input use typically carry the highest footprints. Key emission drivers include methane from livestock and rice systems, nitrous oxide from fertilizers, and CO₂ from land-use change, energy use, and processing. Beyond the farm, long and fragmented supply chains add hidden emissions from transport, storage, and waste.
Understanding which products generate the most emissions is now essential for ESG reporting, Scope 3 accounting, SBTi target-setting, and making carbon-smart sourcing decisions across global value chains.
| Product | Primary Carbon Metric & Footprint | Primary Emission Source | Decarbonization Focus |
| Beef | 60 kgCO₂e per kg | Methane (enteric fermentation), Land-Use Change (grazing/feed expansion). | Regenerative grazing, Feed additives, Halting deforestation. |
| Dairy (Cheese) | 20-25 kgCO₂e per kg | Methane from cows, Energy-intensive processing (concentration). | Manure management (N2O), Energy efficiency in processing. |
| Pork | 2.25–6.75 kgCO₂e per kg | Feed production (N2O), Manure methaneN2O from slurry. | Anaerobic digesters for manure, Sustainable feed sourcing. |
| Cocoa | 1.47–23.2 kgCO₂e per kg of beans | Tropical Deforestation and Land-Use Change (LUC). | Agroforestry, Halting expansion into primary forests, Scope 3 traceability. |
| Poultry & Eggs | 5.7 kgCO₂e per 100g protein | Upstream Feed production (Soy, Maize), Housing energy. | Sustainable/low-emission feed sourcing, Energy efficiency in intensive systems. |
| Rice | 2.7–4 kgCO₂e per kg | Methane from flooded anaerobic paddy fields, N2O from fertilizer. | Alternate Wetting and Drying (AWD) technology, Fertilizer optimization. |
| Coffee | 0.9–3 kgCO₂e per kg | Deforestation at origin (LUC), Fertilizer use, Roasting energy. | Agroforestry systems, Traceability of origin, Efficient processing. |
| Dairy (Milk) | 3 kgCO₂e per kg | Methane from cows (enteric fermentation), N2O from manure application. | Feed quality improvement, Manure handling optimization. |
| Palm Oil | 1.5–12 kgCO₂e per kg | Land-Use Change, especially conversion of forest/peatland (massive carbon release). | Zero-deforestation policies, Avoiding peatland cultivation. |
| Soy | 1–2 kgCO₂e per kg | Deforestation for expansion (Amazon/Cerrado), N2O from fertilizer. | Zero-deforestation sourcing, Sustainable intensification, Scope 3 reporting. |
Key Takeaways
Beef, dairy, rice, palm oil, soy, coffee, cocoa, feed crops, poultry, and pork rank among the highest carbon-intensive agrifood products due to land-use change, methane and nitrous oxide emissions, and energy-heavy supply chain operations. Their combined footprint drives a significant share of global agricultural GHGs, making them priority targets for decarbonization strategies.
Beef remains the highest carbon-emitting agricultural product due to methane from enteric fermentation, land-use change for grazing or feed crops, and energy-intensive pasture expansion. Beyond emissions, beef’s carbon intensity is amplified by long production cycles, low feed-to-protein conversion ratios, and deforestation-driven ecosystem loss. Beef generates the highest carbon footprint among foods at 60 kgCO₂e per kg (or 49.9 kgCO₂e per 100g protein), driven by methane from enteric fermentation (27% of livestock emissions), land-use change for grazing/feed (up to 60% lower for dairy beef vs. dedicated herds), and low feed conversion ratios (6-10 kg feed/kg protein).
Even premium “grass-fed” beef can carry higher land-use emissions unless managed under regenerative systems.
Dairy generates substantial methane from cows and nitrous oxide from manure application. Processing especially for cheese adds significant energy demand, while refrigerated transport and cold storage further elevate its footprint. Dairy emissions reach 3 kgCO₂e/kg for milk and 5–10× higher for cheese (e.g., 20-25 kgCO₂e/kg due to concentration/processing), with methane from cows (50-70%) and N₂O from manure adding to refrigerated transport loads
Cheese often has 5–10× the footprint of milk due to concentration of solids and prolonged processing.
Flooded paddy fields produce large volumes of methane due to anaerobic decomposition. Nitrogen fertilizer drives additional nitrous oxide emissions, and high water dependence contributes to indirect energy use. Rice paddy fields emit 2.7-4 kgCO₂e/kg via methane from anaerobic decomposition (37% of global food methane) and N₂O from fertilizers, reducible by 50% through alternate wetting-drying
Alternate wetting and drying (AWD) can cut methane by up to 50%, showing one of the clearest mitigation pathways among staple crops.
Palm oil’s emissions surge in areas converted from forest or peatland, releasing centuries of stored carbon. Industrial processing and long-distance shipping add further load. Palm oil hits 1.5-12 kgCO₂e/kg (land conversion dominant, e.g., peatland releases centuries of carbon), though sustainable variants match alternatives per liter.
Sustainably managed palm oil has a lower footprint per litre than many alternatives—but land-use change dominates the narrative.
Soy expansion in the Amazon and Cerrado contributes to significant carbon loss. Most soy becomes animal feed, embedding its footprint into poultry, pork, dairy, and aquaculture supply chains. Soy contributes 1-2 kgCO₂e/kg, amplified in Amazon/Cerrado deforestation (19% global food footprint) as 70-80% feeds livestock, embedding in Scope 3
Soy’s carbon intensity is often “hidden” in livestock supply chains, making it one of the biggest drivers of Scope 3 emissions.
Coffee’s footprint stems from deforestation at origin, fertilizer use, washing/processing energy, and global transport. Roasting adds significant energy intensity. Coffee yields 0.9-3 kgCO₂e/kg (70% from land-use in origins), plus roasting/shipping; cocoa 2-5 kgCO₂e/kg (>70% Scope 3 for chocolate from tropical deforestation)
Up to 70% of coffee’s emissions in some regions come from land-use change alone, far exceeding processing or logistics.
Cocoa is a leading contributor to tropical deforestation due to expansion into primary forests. Fertilizer, fermentation, and global shipping add further emissions. Cocoa production emits 1.47–23.2 kgCO₂e per kg of beans on average, with deforestation contributing up to 95% in global averages (e.g., 70%+ of chocolate’s total Scope 3 footprint), agriculture/ILUC at 14.89–17.3 kgCO₂e/kg for powder, and processing/transport minor (0.65–4.31 kgCO₂e/kg).
For chocolate companies, cocoa often represents the single largest Scope 3 hotspot—sometimes >70% of the total product footprint.
Feed crops such as maize, sorghum, and barley carry heavy fertilizer-driven emissions. Tillage releases soil carbon, and irrigation adds energy use. Maize/feed crops emit 0.5-1.5 kgCO₂e/kg from N fertilizers/tillage, multiplying into poultry/pork/dairy (70% of poultry footprint)
Feed crops act as “upstream multipliers”—their emissions amplify the footprint of poultry, pork, eggs, and dairy.
Although poultry has lower carbon intensity per kg than beef or pork, its footprint is dominated by high-emission feed ingredients such as soy and maize. Intensive systems require heating, ventilation, and processing energy. Poultry/eggs: 5.7 kgCO₂e per 100g protein (feed 70%), pork 7.6 kgCO₂e per 100g (manure methane key, digesters cut 30-50%).
Feed accounts for up to 70% of all poultry emissions—making Scope 3 feed supply a top priority for reduction.
Pork emissions stem from manure methane, nitrous oxide from slurry management, and feed production. Energy-intensive processing and cold-chain storage elevate downstream emissions. Pork production emits 2.25–6.75 kgCO₂e per kg of live weight or 2.4–4.63 kgCO₂e per kg of retail cuts (e.g., ground pork at 4.63 kgCO₂e/kg), with feed accounting for 42–70% of emissions, manure methane/N₂O from slurry 20–30%, and processing/cold-chain adding 10–15%.
Improving manure handling (anaerobic digesters) can cut pork emissions more effectively than diet changes alone.
High-carbon agribusiness products share common structural emission drivers rooted in biology, land systems, and global trade dynamics. Land-use change including deforestation, peatland drainage, and habitat conversion creates a massive one-time carbon release that inflates the lifetime footprint of commodities like beef, palm oil, soy, and cocoa. Fertilizer use drives nitrous oxide emissions, a greenhouse gas nearly 300x more potent than CO₂, making crops like maize, rice, and feed grains particularly carbon-intensive.
Enteric methane, a natural byproduct of ruminant digestion, is the dominant source of livestock emissions, while energy-intensive processing (e.g., dairy, coffee, cocoa, palm oil refining) compounds total Scope 1–3 impacts. Additionally, long-distance, multimodal global trade adds transport-related emissions especially relevant for coffee, soy, palm oil, and cocoa supply chains that move across continents. Finally, multi-stage value chains involving farming, aggregation, processing, refrigeration, packaging, and retail amplify cumulative emissions, exposing hotspots that are often invisible without granular, product-level carbon accounting.
Collectively, these drivers show that the carbon intensity of agribusiness is not just about production it’s a complex interplay of land systems, biological processes, industrial energy use, and globalized supply chain architecture.
Global agribusiness is under unprecedented pressure to reduce emissions, strengthen traceability, and prove responsible sourcing. A rapidly evolving regulatory environment combined with retailer scorecards and shifting consumer expectations is reshaping how high-carbon products are grown, processed, traded, and reported.
The EUDR requires full traceability to the farm or plot of land for commodities like beef, soy, palm oil, cocoa, coffee, and rubber. Agribusiness firms must prove:
This raises compliance expectations for producers and exporters while rewarding companies with advanced traceability systems.
The SBTi FLAG framework pushes agribusiness companies to:
High-carbon commodities like beef, dairy, soy, palm oil, and cocoa now require targeted decarbonization strategies not generic corporate pledges.
Scope 3 emissions can represent 70–90% of a food company’s total footprint, especially for animal proteins and global commodities. Companies must now:
Large buyers increasingly demand emission disclosures from farmers, cooperatives, and processors.
Major retailers—Walmart, Tesco, Carrefour, Ahold Delhaize score suppliers based on:
Suppliers with high-carbon products risk delisting, lower shelf space, or stricter contract terms, while low-carbon suppliers gain competitive advantages.
Certification systems now function as both market access filters and carbon-reduction mechanisms:
Certified suppliers often command premium pricing and long-term contracts.
Agribusinesses can significantly cut their carbon footprint by adopting a combination of technology, sustainable practices, and supplier engagement strategies. Key approaches include:
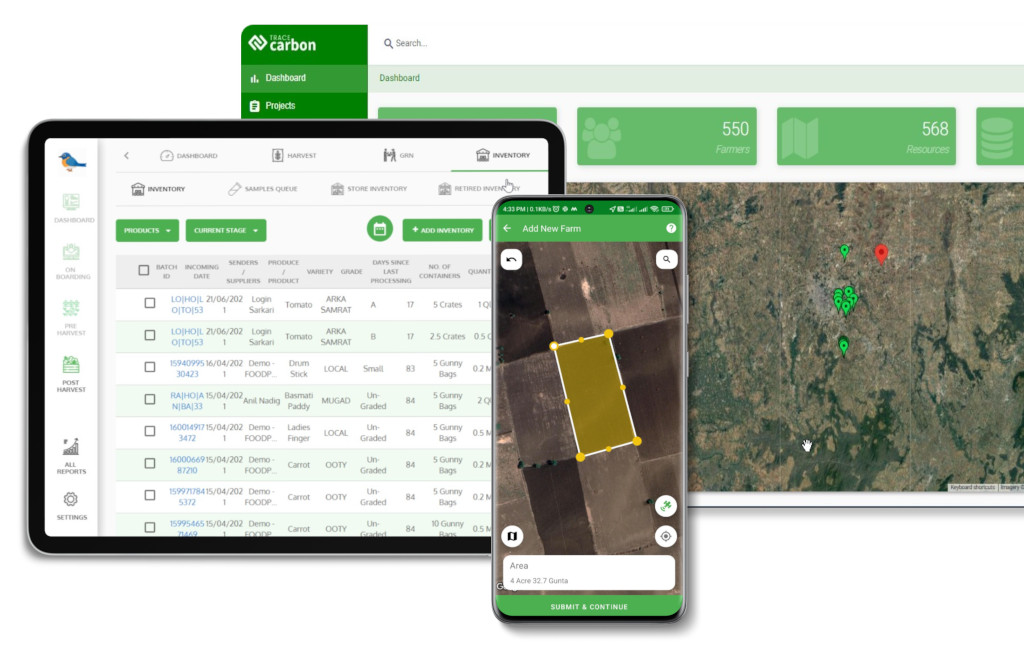
Implement farm-to-fork traceability systems to monitor carbon hotspots across supply chains. Digital platforms capture farm-level data on inputs, yields, and emissions, enabling actionable insights and verified reporting for ESG, Scope 3, and SBTi compliance.
Adopt soil- and ecosystem-restoring practices such as cover cropping, crop rotation, reduced tillage, and agroforestry. These methods sequester carbon, enhance soil health, and improve climate resilience while maintaining productivity.
Use IoT sensors, GIS mapping, and drone imagery to optimize input application—fertilizers, water, and pesticides. Precision farming reduces overuse, lowers emissions, and increases yield efficiency.
Switch to slow-release, nitrogen-efficient, or bio-based fertilizers to minimize nitrous oxide emissions from soils. Combining with precision application further reduces environmental impact.
Prioritize suppliers who follow deforestation-free, climate-smart, and low-carbon practices. Incorporating supplier ESG metrics into sourcing decisions ensures accountability and reduces embedded emissions.
Leverage remote sensing, satellite monitoring, and blockchain verification to confirm that commodities like palm oil, soy, cocoa, and timber are free from deforestation or land conversion. This strengthens regulatory compliance and brand reputation.
Optimize cold chains, transport routes, and storage practices to reduce energy use. Implement renewable energy sources and energy-efficient equipment to cut emissions across post-harvest and distribution phases.
Collaborate with farmers and upstream suppliers to promote sustainable practices, provide training, and incentivize carbon-reducing techniques. Engaging smallholders in emissions reduction efforts ensures scalable impact across multi-tier supply chains.
By integrating these strategies, agribusinesses can reduce operational emissions, meet global sustainability standards, and gain competitive advantage in carbon-conscious markets.
Digital traceability and Monitoring, Reporting, and Verification (MRV) tools are central to reducing carbon emissions and ensuring compliance across agribusiness supply chains.
MRV platforms capture on-farm data, including input use, crop yields, soil health, and livestock emissions. This enables precise calculation of carbon footprints at the plot level, forming the foundation for Scope 3 reporting and carbon-reduction strategies.
GIS mapping, satellite imagery, and drone surveys provide verified geolocation data for every farm. These tools confirm land tenure, monitor deforestation or land conversion, and ensure that sourced commodities align with deforestation- and conversion-free requirements.
Traceability platforms consolidate supplier, farm, and processing data to automate emissions reporting across complex multi-tier supply chains. This reduces manual errors, accelerates reporting cycles, and ensures compliance with frameworks like SBTi FLAG and EUDR.
Digital platforms assign unique IDs to each batch of produce, linking farm origin, handling, and transport. Blockchain-backed MRV ensures tamper-proof, audit-ready records for both regulators and buyers.
By integrating environmental, social, and land-use metrics, traceability tools assess supplier risk profiles. Companies can identify high-emission or non-compliant suppliers and prioritize engagement, remediation, or alternative sourcing.
The TraceX DMRV (Digital Monitoring, Reporting, and Verification) platform empowers agribusinesses to measure, monitor, and manage carbon emissions at every stage of the value chain. By combining farm-level geolocation, crop-specific emission tracking, and automated Scope 3 reporting, DMRV provides a single source of truth for sustainability data. The platform also generates audit-ready, verifiable digital records, enabling companies to demonstrate compliance with regulations like EUDR, SBTi FLAG, and Scope 3 reporting. Beyond compliance, TraceX DMRV turns raw data into actionable insights, helping businesses optimize practices, reduce carbon footprints, and achieve credible, traceable sustainability credentials.
Embracing carbon intelligence is no longer optional—it is a strategic imperative. By measuring and reducing emissions across farms, supply chains, and processing operations, agribusinesses can unlock cost efficiencies, meet regulatory and buyer expectations, and strengthen brand credibility. The industry is shifting from volume-driven commodity sourcing to responsible, fully traceable procurement, where verified sustainability credentials and emissions transparency become key differentiators. Companies that invest in digital traceability, MRV tools, and climate-smart practices position themselves to lead in global markets, ensuring long-term resilience, compliance, and a tangible positive impact on the planet.
Accelerate Your Low-Carbon Transition
Read the Full Guide to Low-Carbon Agri Supply Chains
Future-Proof Your Farms
Read How to Build Climate-Resilient Agriculture Systems
Unlock Scope 3 Visibility
Read the Complete Guide to Scope 3 Emissions
Key high-carbon products include beef, dairy (milk and cheese), rice, palm oil, soy, coffee, cocoa, maize, poultry, and pork due to their production processes and supply chain emissions.
High emissions result from land-use change, enteric methane, fertilizer use, energy-intensive processing, long-distance transportation, and multi-stage value chains.
Companies can implement digital traceability, regenerative agriculture, precision farming, low-emission fertilizers, sustainable procurement, verified deforestation-free sourcing, and climate-smart storage and logistics.